
Pic: SIphotography, iStock / Getty Images Plus
Gold Digger: The Platinum Group Metals sector is at a crossroads, and no one can agree what the future looks like
Mining
Pic: SIphotography, iStock / Getty Images Plus
Mining
Our Gold Digger column wraps all the news driving ASX stocks with exposure to precious metals.
The recent London Platinum Week brought to light contrasting viewpoints regarding future demand and supply for platinum group metals (PGMs), says Metals Focus.
Notably, the perspectives on key demand drivers and their implications for autocatalyst demand are diverging.
The biggest demand sector for PGMs is ‘auto catalysts’ in car exhausts which reduce polluting emissions in ICE and hybrid vehicles.
These auto catalysts, or catalytic convertors, account for 40% and 80% of annual platinum and palladium production, respectively.
They look something like this:

Electric vehicles don’t need catalytic convertors, and therein lies the conundrum for PGM producers, which are relying on an emergent hydrogen economy to take up the slack in demand.
(PGMs are used as catalysts in electrolysers and fuel cells).
“There are differing views on the pace of vehicle electrification by various stakeholders,” Metals Focus writes.
“Furthermore, the uncertain growth trajectory of the hydrogen economy is also contributing to disparate opinions.”
This means producers have shown a reluctance to expand production or bring new mines online.
“Uncertainty surrounding future demand and PGM price volatility has led to a conservative approach to expansion capex to bring additional production online and secure output beyond current mine lives,” Metals Focus writes.
“The volatile PGM basket pricing presents a challenge to miners when considering their capital allocation strategy.
“Given the project execution risk and long timeline required to develop a new mine, operations commonly enter production in very different market conditions to those that their feasibility studies anticipated.
“Thus, in recent years M&A has been favoured over project development.”
Globally, platinum and rhodium mine supply is expected to remain flat at 5.5Moz and 0.7Moz respectively in 2023. Palladium is expected to decline 4% to 6.3Moz.
Gold surged early May on the risk of a US default, but as time went on the potential for a catastrophic default loomed ever larger, eventually hurting gold prices as well.
The bipartisan debt deal has now passed, and gold has bounced back above US$1980/oz.
With that out of the way gold’s biggest challenge remains more interest rate increases, says OANDA analyst Ed Moya.
“Another dose of robust labour data is raising the risk that the Fed will need to do more tightening that will eventually lead to much weaker lending,” Moya says.
“Unless inflation plays nice over the next few months, the US economy is likely headed towards a recession.
“The risks of inflation being sticky should be the base case, which means the Fed will raise rates at least once more.”
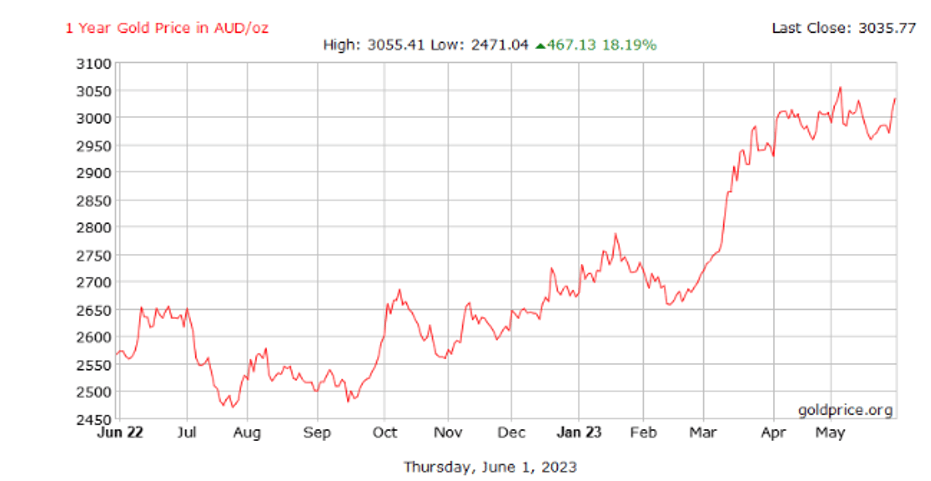
Gold was paying US$1982/oz Friday arvo, or $3000/oz in the local currency — just one pineapple shy of all-time highs, and great news for our local producers.
Here’s how the ASX-listed precious metals stocks are performing this week:
Scroll or swipe to reveal table. Click headings to sort. Best viewed on a laptop.
Stocks missing from this list? Email [email protected] to complain.
| CODE | COMPANY | 1 WEEK RETURN % | YEAR TO DATE RETURN % | 12 MONTH RETURN % | PRICE | MARKET CAP |
|---|---|---|---|---|---|---|
| GSM | Golden State Mining | 77% | 23% | -17% | 0.053 | $7,646,003 |
| CAZ | Cazaly Resources | 48% | 9% | -14% | 0.037 | $13,385,585 |
| MHC | Manhattan Corp Ltd | 45% | 45% | -27% | 0.008 | $19,085,812 |
| HAW | Hawthorn Resources | 34% | -18% | -18% | 0.094 | $30,821,436 |
| MCT | Metalicity Limited | 33% | -33% | -60% | 0.002 | $7,472,172 |
| LRL | Labyrinth Resources | 27% | -18% | -44% | 0.014 | $12,473,335 |
| DTR | Dateline Resources | 25% | -46% | -83% | 0.02 | $15,240,385 |
| MEI | Meteoric Resources | 23% | 353% | 1614% | 0.24 | $376,595,964 |
| G88 | Golden Mile Res Ltd | 22% | 8% | -56% | 0.022 | $5,872,506 |
| TMB | Tambourahmetals | 22% | 5% | -52% | 0.11 | $4,531,186 |
| AAU | Antilles Gold Ltd | 22% | 50% | -36% | 0.045 | $26,696,067 |
| NAE | New Age Exploration | 20% | -14% | -40% | 0.006 | $10,051,292 |
| MOM | Moab Minerals Ltd | 18% | 11% | -64% | 0.01 | $6,137,671 |
| IPT | Impact Minerals | 17% | 100% | 40% | 0.014 | $34,136,447 |
| ADV | Ardiden Ltd | 17% | 0% | -36% | 0.007 | $18,818,347 |
| AL8 | Alderan Resource Ltd | 17% | 0% | -65% | 0.007 | $4,316,863 |
| A8G | Australasian Metals | 15% | -21% | -61% | 0.15 | $8,339,279 |
| TAR | Taruga Minerals | 15% | -38% | -35% | 0.015 | $11,296,429 |
| PXX | Polarx Limited | 15% | -25% | 0% | 0.015 | $18,954,742 |
| GTR | Gti Energy Ltd | 14% | -26% | -52% | 0.008 | $13,634,279 |
| AVM | Advance Metals Ltd | 14% | -20% | -27% | 0.008 | $4,119,911 |
| MEG | Megado Minerals Ltd | 14% | 27% | -61% | 0.057 | $13,486,145 |
| GCY | Gascoyne Res Ltd | 12% | -16% | -44% | 0.14 | $127,166,900 |
| ASR | Asra Minerals Ltd | 11% | -50% | -75% | 0.01 | $11,736,949 |
| REZ | Resourc & En Grp Ltd | 9% | -25% | -66% | 0.012 | $5,997,669 |
| ICG | Inca Minerals Ltd | 9% | 9% | -68% | 0.025 | $12,087,862 |
| AME | Alto Metals Limited | 8% | -3% | -21% | 0.065 | $38,607,375 |
| AZS | Azure Minerals | 8% | 131% | 86% | 0.52 | $210,727,479 |
| POL | Polymetals Resources | 8% | 35% | 154% | 0.33 | $32,070,288 |
| TG1 | Techgen Metals Ltd | 8% | -1% | -46% | 0.081 | $5,273,513 |
| BGD | Bartongoldholdings | 8% | 38% | 25% | 0.275 | $22,446,605 |
| GMD | Genesis Minerals | 8% | 2% | -16% | 1.27 | $599,273,263 |
| LCY | Legacy Iron Ore | 7% | -16% | -33% | 0.016 | $96,102,393 |
| AUC | Ausgold Limited | 6% | 6% | -15% | 0.05 | $110,214,778 |
| VKA | Viking Mines Ltd | 6% | -15% | -6% | 0.0085 | $8,202,067 |
| FG1 | Flynngold | 6% | -30% | -48% | 0.07 | $7,201,148 |
| PGO | Pacgold | 6% | -3% | -44% | 0.35 | $18,137,399 |
| EMC | Everest Metals Corp | 6% | 14% | -14% | 0.09 | $11,648,980 |
| EM2 | Eagle Mountain | 5% | -38% | -77% | 0.105 | $33,546,355 |
| HMG | Hamelingoldlimited | 5% | -21% | -15% | 0.115 | $15,812,500 |
| CLA | Celsius Resource Ltd | 4% | 56% | 32% | 0.025 | $55,276,292 |
| CPM | Coopermetalslimited | 4% | 6% | -46% | 0.25 | $10,729,069 |
| IVR | Investigator Res Ltd | 4% | 26% | -2% | 0.053 | $73,295,671 |
| BGL | Bellevue Gold Ltd | 4% | 17% | 51% | 1.325 | $1,452,101,052 |
| SVY | Stavely Minerals Ltd | 4% | -45% | -58% | 0.135 | $42,415,583 |
| DEG | De Grey Mining | 4% | 9% | 24% | 1.405 | $2,091,963,666 |
| DCN | Dacian Gold Ltd | 4% | -14% | -55% | 0.086 | $105,861,682 |
| CDR | Codrus Minerals Ltd | 4% | 12% | 69% | 0.145 | $5,862,350 |
| AGG | AngloGold Ashanti | 3% | 27% | 46% | 7.44 | $646,756,296 |
| CMM | Capricorn Metals | 3% | -3% | 18% | 4.45 | $1,624,139,316 |
| STN | Saturn Metals | 3% | -6% | -55% | 0.17 | $28,985,509 |
| FML | Focus Minerals Ltd | 3% | -27% | 9% | 0.185 | $55,878,936 |
| LYN | Lycaonresources | 3% | -25% | -53% | 0.205 | $7,571,313 |
| LCL | Los Cerros Limited | 2% | -26% | -36% | 0.042 | $32,566,483 |
| TRM | Truscott Mining Corp | 2% | 12% | -19% | 0.046 | $7,689,225 |
| RSG | Resolute Mining | 2% | 140% | 95% | 0.48 | $1,021,923,153 |
| HCH | Hot Chili Ltd | 2% | 15% | -17% | 1.01 | $128,403,596 |
| WGX | Westgold Resources. | 2% | 84% | 12% | 1.61 | $731,747,118 |
| NST | Northern Star | 2% | 22% | 49% | 13.31 | $14,849,142,212 |
| ENR | Encounter Resources | 2% | 61% | 115% | 0.29 | $112,724,848 |
| RMS | Ramelius Resources | 1% | 53% | 8% | 1.42 | $1,338,430,109 |
| SPD | Southernpalladium | 1% | -41% | 0% | 0.475 | $19,385,247 |
| SFR | Sandfire Resources | 1% | 4% | 3% | 5.65 | $2,627,128,586 |
| MRR | Minrex Resources Ltd | 0% | -56% | -75% | 0.014 | $15,730,579 |
| NPM | Newpeak Metals | 0% | 0% | 0% | 0.001 | $9,145,132 |
| FFX | Firefinch Ltd | 0% | 0% | -48% | 0.2 | $236,569,315 |
| DCX | Discovex Res Ltd | 0% | -17% | -63% | 0.0025 | $8,256,420 |
| AQX | Alice Queen Ltd | 0% | -50% | -80% | 0.001 | $2,530,288 |
| PNX | PNX Metals Limited | 0% | -29% | -36% | 0.003 | $16,141,874 |
| FAU | First Au Ltd | 0% | -13% | -73% | 0.0035 | $5,081,976 |
| GWR | GWR Group Ltd | 0% | 10% | -43% | 0.065 | $20,879,083 |
| PUA | Peak Minerals Ltd | 0% | -50% | -79% | 0.003 | $3,124,130 |
| CWX | Carawine Resources | 0% | 0% | -31% | 0.1 | $19,681,747 |
| RND | Rand Mining Ltd | 0% | -13% | -21% | 1.18 | $67,113,634 |
| BMR | Ballymore Resources | 0% | -7% | -32% | 0.14 | $13,484,444 |
| CYL | Catalyst Metals | 0% | -35% | -51% | 0.77 | $117,038,831 |
| SIH | Sihayo Gold Limited | 0% | 0% | -33% | 0.002 | $12,204,256 |
| WCN | White Cliff Min Ltd | 0% | -50% | -70% | 0.007 | $6,233,854 |
| WRM | White Rock Min Ltd | 0% | -5% | -52% | 0.063 | $17,508,200 |
| CTO | Citigold Corp Ltd | 0% | -17% | -17% | 0.005 | $14,368,295 |
| TIE | Tietto Minerals | 0% | -27% | 17% | 0.515 | $538,326,108 |
| TRY | Troy Resources Ltd | 0% | 0% | 0% | 0.0295 | $62,920,961 |
| CGN | Crater Gold Min Ltd | 0% | 0% | 0% | 0.014499 | $17,965,037 |
| SVG | Savannah Goldfields | 0% | -24% | -28% | 0.145 | $29,377,266 |
| GUL | Gullewa Limited | 0% | -8% | -26% | 0.055 | $10,767,521 |
| G50 | Gold50Limited | 0% | -40% | -29% | 0.15 | $8,541,450 |
| MTH | Mithril Resources | 0% | -43% | -67% | 0.002 | $6,737,609 |
| ADG | Adelong Gold Limited | 0% | 29% | -74% | 0.009 | $4,804,401 |
| RMX | Red Mount Min Ltd | 0% | -20% | -53% | 0.004 | $9,087,404 |
| PRS | Prospech Limited | 0% | 49% | 8% | 0.04 | $8,512,832 |
| XTC | Xantippe Res Ltd | 0% | -20% | -64% | 0.004 | $45,920,399 |
| KZR | Kalamazoo Resources | 0% | -38% | -61% | 0.13 | $19,050,794 |
| BCN | Beacon Minerals | 0% | 11% | -3% | 0.031 | $112,703,045 |
| RML | Resolution Minerals | 0% | -38% | -44% | 0.005 | $6,286,459 |
| TBA | Tombola Gold Ltd | 0% | 0% | -54% | 0.026 | $33,129,243 |
| VRC | Volt Resources Ltd | 0% | -33% | -50% | 0.01 | $37,424,527 |
| ARV | Artemis Resources | 0% | -52% | -68% | 0.012 | $18,839,020 |
| SFM | Santa Fe Minerals | 0% | -25% | -40% | 0.06 | $4,369,127 |
| X64 | Ten Sixty Four Ltd | 0% | -11% | -25% | 0.57 | $130,184,182 |
| SI6 | SI6 Metals Limited | 0% | 0% | -25% | 0.006 | $10,467,762 |
| KWR | Kingwest Resources | 0% | -17% | -79% | 0.029 | $8,170,078 |
| AGC | AGC Ltd | 0% | -3% | -36% | 0.058 | $5,900,000 |
| RVR | Red River Resources | 0% | 0% | -62% | 0.073 | $37,847,908 |
| CBY | Canterbury Resources | 0% | -15% | -35% | 0.035 | $5,058,324 |
| TMZ | Thomson Res Ltd | 0% | -74% | -81% | 0.005 | $4,349,755 |
| WMC | Wiluna Mining Corp | 0% | 0% | -58% | 0.205 | $74,238,031 |
| RED | Red 5 Limited | 0% | -27% | -61% | 0.15 | $518,922,507 |
| THR | Thor Energy PLC | 0% | -17% | -63% | 0.005 | $7,368,064 |
| HRZ | Horizon | 0% | -26% | -65% | 0.045 | $29,273,314 |
| ALY | Alchemy Resource Ltd | 0% | -22% | -25% | 0.018 | $21,205,373 |
| OBM | Ora Banda Mining Ltd | 0% | 67% | 259% | 0.14 | $217,503,930 |
| SLR | Silver Lake Resource | 0% | -10% | -32% | 1.07 | $971,582,828 |
| AVW | Avira Resources Ltd | 0% | 0% | -25% | 0.003 | $6,401,370 |
| PDI | Predictive Disc Ltd | 0% | -11% | -18% | 0.16 | $278,628,551 |
| STK | Strickland Metals | 0% | 8% | -40% | 0.043 | $69,949,049 |
| CEL | Challenger Exp Ltd | 0% | -9% | -38% | 0.16 | $171,530,498 |
| CHZ | Chesser Resources | 0% | 35% | 15% | 0.115 | $66,217,652 |
| S2R | S2 Resources | 0% | -24% | -32% | 0.13 | $57,412,813 |
| NES | Nelson Resources. | 0% | -29% | -64% | 0.005 | $2,942,972 |
| OAU | Ora Gold Limited | 0% | -40% | -66% | 0.003 | $11,810,775 |
| GNM | Great Northern | 0% | -50% | -60% | 0.002 | $4,272,627 |
| RRL | Regis Resources | 0% | 0% | 2% | 2.06 | $1,525,152,369 |
| DEXDA | Duke Exploration | 0% | 0% | -52% | 0.053 | $2,462,016 |
| AYM | Australia United Min | 0% | 33% | -33% | 0.004 | $7,370,310 |
| ANL | Amani Gold Ltd | 0% | 0% | -50% | 0.001 | $25,143,441 |
| FEG | Far East Gold | 0% | -35% | -6% | 0.31 | $45,914,463 |
| CLZ | Classic Min Ltd | 0% | -89% | -99% | 0.001 | $7,013,882 |
| ORN | Orion Minerals Ltd | 0% | 19% | -14% | 0.019 | $107,293,923 |
| NCM | Newcrest Mining | -1% | 27% | 5% | 26.3 | $22,972,787,505 |
| MRZ | Mont Royal Resources | -1% | -50% | -75% | 0.087 | $5,957,992 |
| EMR | Emerald Res NL | -1% | 65% | 59% | 1.96 | $1,119,382,685 |
| ARL | Ardea Resources Ltd | -1% | -49% | -72% | 0.365 | $63,027,269 |
| TUL | Tulla Resources | -1% | 1% | -46% | 0.34 | $113,194,558 |
| TGM | Theta Gold Mines Ltd | -1% | 0% | -35% | 0.068 | $42,374,331 |
| MZZ | Matador Mining Ltd | -1% | -43% | -64% | 0.066 | $22,065,318 |
| WAF | West African Res Ltd | -2% | -25% | -32% | 0.885 | $885,394,751 |
| MKR | Manuka Resources. | -2% | -31% | -73% | 0.059 | $31,911,334 |
| GOR | Gold Road Res Ltd | -2% | 8% | 35% | 1.83 | $1,898,021,648 |
| MGV | Musgrave Minerals | -2% | 12% | -24% | 0.235 | $130,065,749 |
| SKY | SKY Metals Ltd | -2% | -6% | -44% | 0.045 | $19,773,221 |
| PRU | Perseus Mining Ltd | -2% | -9% | -2% | 1.91 | $2,496,576,001 |
| SVL | Silver Mines Limited | -3% | -3% | 3% | 0.195 | $280,866,429 |
| GBR | Greatbould Resources | -3% | -14% | -16% | 0.078 | $39,836,303 |
| GML | Gateway Mining | -3% | -35% | -65% | 0.039 | $10,919,675 |
| SSR | SSR Mining Inc. | -3% | -1% | -17% | 22.9 | $397,828,346 |
| VMC | Venus Metals Cor Ltd | -3% | 37% | -8% | 0.185 | $33,527,306 |
| SBM | St Barbara Limited | -3% | -28% | -56% | 0.555 | $436,849,780 |
| MAT | Matsa Resources | -3% | -3% | -29% | 0.036 | $14,832,265 |
| RXL | Rox Resources | -3% | 106% | 4% | 0.36 | $80,767,534 |
| KIN | KIN Min NL | -3% | -46% | -56% | 0.035 | $38,878,968 |
| PNR | Pantoro Limited | -3% | -28% | -76% | 0.069 | $208,988,619 |
| YRL | Yandal Resources | -3% | -31% | -67% | 0.068 | $10,730,609 |
| SRN | Surefire Rescs NL | -3% | 42% | -50% | 0.017 | $28,073,179 |
| ICL | Iceni Gold | -3% | -15% | -50% | 0.068 | $13,348,571 |
| PUR | Pursuit Minerals | -3% | 6% | -23% | 0.017 | $44,314,264 |
| TAM | Tanami Gold NL | -3% | -15% | -39% | 0.033 | $38,778,203 |
| CHN | Chalice Mining Ltd | -3% | 12% | 11% | 7.08 | $2,702,382,795 |
| KCN | Kingsgate Consolid. | -3% | -26% | -27% | 1.275 | $319,612,098 |
| DLI | Delta Lithium | -3% | 33% | 17% | 0.63 | $294,658,536 |
| CDT | Castle Minerals | -3% | -29% | -61% | 0.015 | $16,867,395 |
| PNM | Pacific Nickel Mines | -4% | -1% | 12% | 0.082 | $32,753,280 |
| MKG | Mako Gold | -4% | -33% | -68% | 0.027 | $14,644,775 |
| USL | Unico Silver Limited | -4% | -21% | -23% | 0.135 | $37,746,578 |
| HAV | Havilah Resources | -4% | -24% | -6% | 0.25 | $79,159,803 |
| XAM | Xanadu Mines Ltd | -4% | 69% | 88% | 0.049 | $81,891,210 |
| HRN | Horizon Gold Ltd | -4% | 16% | 3% | 0.36 | $46,943,115 |
| QML | Qmines Limited | -4% | -27% | -45% | 0.12 | $20,753,874 |
| BRB | Breaker Res NL | -4% | 48% | 111% | 0.475 | $158,126,031 |
| ADT | Adriatic Metals | -4% | -3% | 29% | 3.04 | $708,763,140 |
| SBR | Sabre Resources | -4% | -42% | -63% | 0.022 | $6,412,696 |
| TBR | Tribune Res Ltd | -5% | -17% | -19% | 3.33 | $174,194,016 |
| IDA | Indiana Resources | -5% | -25% | -27% | 0.041 | $22,334,222 |
| OZM | Ozaurum Resources | -5% | -38% | -78% | 0.041 | $5,207,000 |
| SMI | Santana Minerals Ltd | -5% | -7% | -33% | 0.61 | $103,278,671 |
| SPQ | Superior Resources | -5% | -46% | -15% | 0.0305 | $51,367,505 |
| SNG | Siren Gold | -5% | -45% | -74% | 0.1 | $13,425,881 |
| KAU | Kaiser Reef | -5% | 15% | 3% | 0.19 | $28,062,560 |
| AQI | Alicanto Min Ltd | -5% | -12% | -47% | 0.038 | $19,452,125 |
| ALK | Alkane Resources Ltd | -5% | 38% | -33% | 0.74 | $442,156,912 |
| EVN | Evolution Mining Ltd | -5% | 16% | -10% | 3.46 | $6,312,456,137 |
| GSR | Greenstone Resources | -5% | -44% | -63% | 0.018 | $21,838,831 |
| TLM | Talisman Mining | -5% | 29% | 3% | 0.18 | $33,793,109 |
| KRM | Kingsrose Mining Ltd | -5% | -17% | -23% | 0.054 | $39,883,906 |
| CAI | Calidus Resources | -5% | -35% | -79% | 0.175 | $101,633,046 |
| IGO | IGO Limited | -5% | 2% | 9% | 13.75 | $10,798,639,013 |
| BYH | Bryah Resources Ltd | -6% | -34% | -63% | 0.017 | $5,625,069 |
| ANX | Anax Metals Ltd | -6% | 28% | -23% | 0.068 | $26,201,269 |
| KCC | Kincora Copper | -6% | -10% | -27% | 0.066 | $7,871,178 |
| TMX | Terrain Minerals | -6% | 33% | -20% | 0.008 | $8,665,594 |
| MEU | Marmota Limited | -6% | -33% | -53% | 0.032 | $33,881,618 |
| MEK | Meeka Metals Limited | -6% | -53% | -54% | 0.032 | $36,298,704 |
| CST | Castile Resources | -6% | -1% | -46% | 0.094 | $21,287,414 |
| MTC | Metalstech Ltd | -6% | -40% | -19% | 0.31 | $57,713,367 |
| GMR | Golden Rim Resources | -6% | -3% | -53% | 0.03 | $17,747,651 |
| TMS | Tennant Minerals Ltd | -6% | -3% | -29% | 0.03 | $22,783,002 |
| GRL | Godolphin Resources | -6% | -29% | -49% | 0.059 | $7,102,167 |
| AMI | Aurelia Metals Ltd | -7% | -18% | -70% | 0.098 | $135,745,006 |
| LM8 | Lunnonmetalslimited | -7% | 6% | 6% | 0.95 | $106,603,294 |
| NAG | Nagambie Resources | -7% | -39% | -20% | 0.04 | $23,269,053 |
| WWI | West Wits Mining Ltd | -7% | -19% | -54% | 0.013 | $29,159,224 |
| TCG | Turaco Gold Limited | -7% | -10% | -40% | 0.052 | $26,141,267 |
| TTM | Titan Minerals | -7% | -24% | -31% | 0.051 | $53,628,381 |
| MXR | Maximus Resources | -8% | -10% | -52% | 0.036 | $12,124,119 |
| ARN | Aldoro Resources | -8% | -25% | -48% | 0.12 | $16,130,849 |
| BC8 | Black Cat Syndicate | -8% | 0% | -21% | 0.355 | $97,296,025 |
| KAL | Kalgoorliegoldmining | -8% | -58% | -70% | 0.035 | $2,713,236 |
| AAJ | Aruma Resources Ltd | -8% | 32% | -18% | 0.07 | $10,987,305 |
| MAU | Magnetic Resources | -8% | -40% | -63% | 0.52 | $123,036,554 |
| ASO | Aston Minerals Ltd | -8% | 0% | -38% | 0.08 | $89,178,475 |
| MLS | Metals Australia | -8% | -24% | -60% | 0.034 | $22,465,303 |
| NVA | Nova Minerals Ltd | -8% | -59% | -57% | 0.28 | $61,158,088 |
| SLZ | Sultan Resources Ltd | -8% | -48% | -70% | 0.044 | $6,372,172 |
| WA8 | Warriedarresourltd | -8% | -35% | -21% | 0.11 | $49,571,763 |
| BEZ | Besragoldinc | -8% | 323% | 182% | 0.22 | $77,849,615 |
| SAU | Southern Gold | -9% | -16% | -48% | 0.021 | $5,705,420 |
| AAR | Astral Resources NL | -9% | -3% | -19% | 0.07 | $50,308,436 |
| MI6 | Minerals260Limited | -9% | 29% | -14% | 0.44 | $111,150,000 |
| NML | Navarre Minerals Ltd | -10% | -54% | -76% | 0.019 | $27,052,725 |
| KNB | Koonenberrygold | -10% | -39% | -58% | 0.038 | $3,030,258 |
| NWM | Norwest Minerals | -10% | -50% | -37% | 0.027 | $6,679,023 |
| ERM | Emmerson Resources | -10% | -17% | -41% | 0.062 | $34,861,426 |
| ADN | Andromeda Metals Ltd | -10% | -20% | -65% | 0.035 | $115,070,312 |
| GIB | Gibb River Diamonds | -11% | -32% | -23% | 0.041 | $8,671,887 |
| RGL | Riversgold | -11% | -47% | -61% | 0.016 | $16,072,951 |
| PKO | Peako Limited | -11% | -45% | -60% | 0.008 | $3,765,852 |
| BBX | BBX Minerals Ltd | -11% | -48% | -71% | 0.055 | $28,464,645 |
| CY5 | Cygnus Metals Ltd | -11% | -49% | 11% | 0.195 | $43,898,846 |
| AUT | Auteco Minerals | -11% | -39% | -40% | 0.031 | $69,385,089 |
| SMS | Starmineralslimited | -12% | -36% | -78% | 0.046 | $1,356,381 |
| BM8 | Battery Age Minerals | -12% | -33% | -33% | 0.335 | $25,605,266 |
| BMO | Bastion Minerals | -12% | -15% | -81% | 0.029 | $4,622,936 |
| KSN | Kingston Resources | -13% | 30% | -28% | 0.105 | $41,565,366 |
| PGD | Peregrine Gold | -13% | -27% | -43% | 0.28 | $16,269,757 |
| RDN | Raiden Resources Ltd | -13% | -26% | -69% | 0.0035 | $9,272,912 |
| GBZ | GBM Rsources Ltd | -13% | -51% | -77% | 0.021 | $14,167,101 |
| BAT | Battery Minerals Ltd | -13% | -13% | -56% | 0.0035 | $13,427,769 |
| RDS | Redstone Resources | -13% | -13% | 0% | 0.007 | $5,802,149 |
| KTA | Krakatoa Resources | -13% | -52% | -75% | 0.021 | $8,357,661 |
| BNR | Bulletin Res Ltd | -13% | -34% | -71% | 0.061 | $18,789,830 |
| NMR | Native Mineral Res | -13% | -75% | -85% | 0.027 | $3,243,746 |
| ZNC | Zenith Minerals Ltd | -13% | -51% | -69% | 0.13 | $47,571,419 |
| NSM | Northstaw | -13% | -16% | -46% | 0.13 | $15,616,510 |
| AZY | Antipa Minerals Ltd | -13% | -38% | -71% | 0.013 | $50,358,721 |
| SXG | Southern Cross Gold | -13% | -39% | -24% | 0.485 | $43,135,663 |
| M2R | Miramar | -13% | -44% | -64% | 0.045 | $3,617,178 |
| NXM | Nexus Minerals Ltd | -14% | -65% | -74% | 0.07 | $23,432,638 |
| GAL | Galileo Mining Ltd | -14% | -34% | -60% | 0.585 | $122,527,455 |
| GED | Golden Deeps | -14% | -33% | -70% | 0.006 | $6,931,360 |
| MVL | Marvel Gold Limited | -14% | -54% | -69% | 0.012 | $11,224,560 |
| PRX | Prodigy Gold NL | -14% | -50% | -64% | 0.006 | $12,257,755 |
| CXU | Cauldron Energy Ltd | -14% | -14% | -61% | 0.006 | $5,589,412 |
| M24 | Mamba Exploration | -14% | -38% | -25% | 0.09 | $5,244,567 |
| LEX | Lefroy Exploration | -15% | -21% | -32% | 0.205 | $33,696,180 |
| TSO | Tesoro Gold Ltd | -15% | -3% | -49% | 0.035 | $38,983,665 |
| KAI | Kairos Minerals Ltd | -15% | -26% | -35% | 0.017 | $33,389,589 |
| HMX | Hammer Metals Ltd | -15% | -10% | -6% | 0.061 | $54,212,885 |
| HXG | Hexagon Energy | -15% | -35% | -58% | 0.011 | $5,642,075 |
| DTM | Dart Mining NL | -16% | -22% | -36% | 0.043 | $7,408,351 |
| OKR | Okapi Resources | -16% | -30% | -60% | 0.105 | $19,434,032 |
| AM7 | Arcadia Minerals | -17% | -27% | -39% | 0.15 | $7,004,684 |
| PNT | Panthermetalsltd | -17% | -66% | -70% | 0.064 | $4,097,050 |
| MDI | Middle Island Res | -17% | -11% | -75% | 0.034 | $5,019,147 |
| DRE | Dreadnought Resources Ltd | -17% | -54% | 14% | 0.048 | $166,386,411 |
| ZAG | Zuleika Gold Ltd | -18% | -33% | -60% | 0.014 | $7,322,709 |
| GSN | Great Southern | -18% | -38% | -59% | 0.018 | $13,173,783 |
| EMU | EMU NL | -20% | -59% | -83% | 0.002 | $3,625,053 |
| BTR | Brightstar Resources | -20% | -29% | -48% | 0.012 | $17,235,970 |
| A1G | African Gold Ltd. | -22% | -36% | -54% | 0.053 | $8,973,494 |
| MM8 | Medallion Metals. | -23% | -52% | -72% | 0.075 | $19,834,397 |
| BNZ | Benzmining | -24% | -27% | -52% | 0.3 | $25,752,078 |
| FAL | Falconmetalsltd | -25% | -18% | -31% | 0.23 | $50,445,000 |
| GMN | Gold Mountain Ltd | -25% | -57% | -40% | 0.003 | $7,879,730 |
| AWJ | Auric Mining | -26% | -33% | -55% | 0.043 | $5,888,682 |
| MBK | Metal Bank Ltd | -28% | -32% | -54% | 0.023 | $7,741,595 |
| MOH | Moho Resources | -32% | -38% | -64% | 0.013 | $3,634,089 |
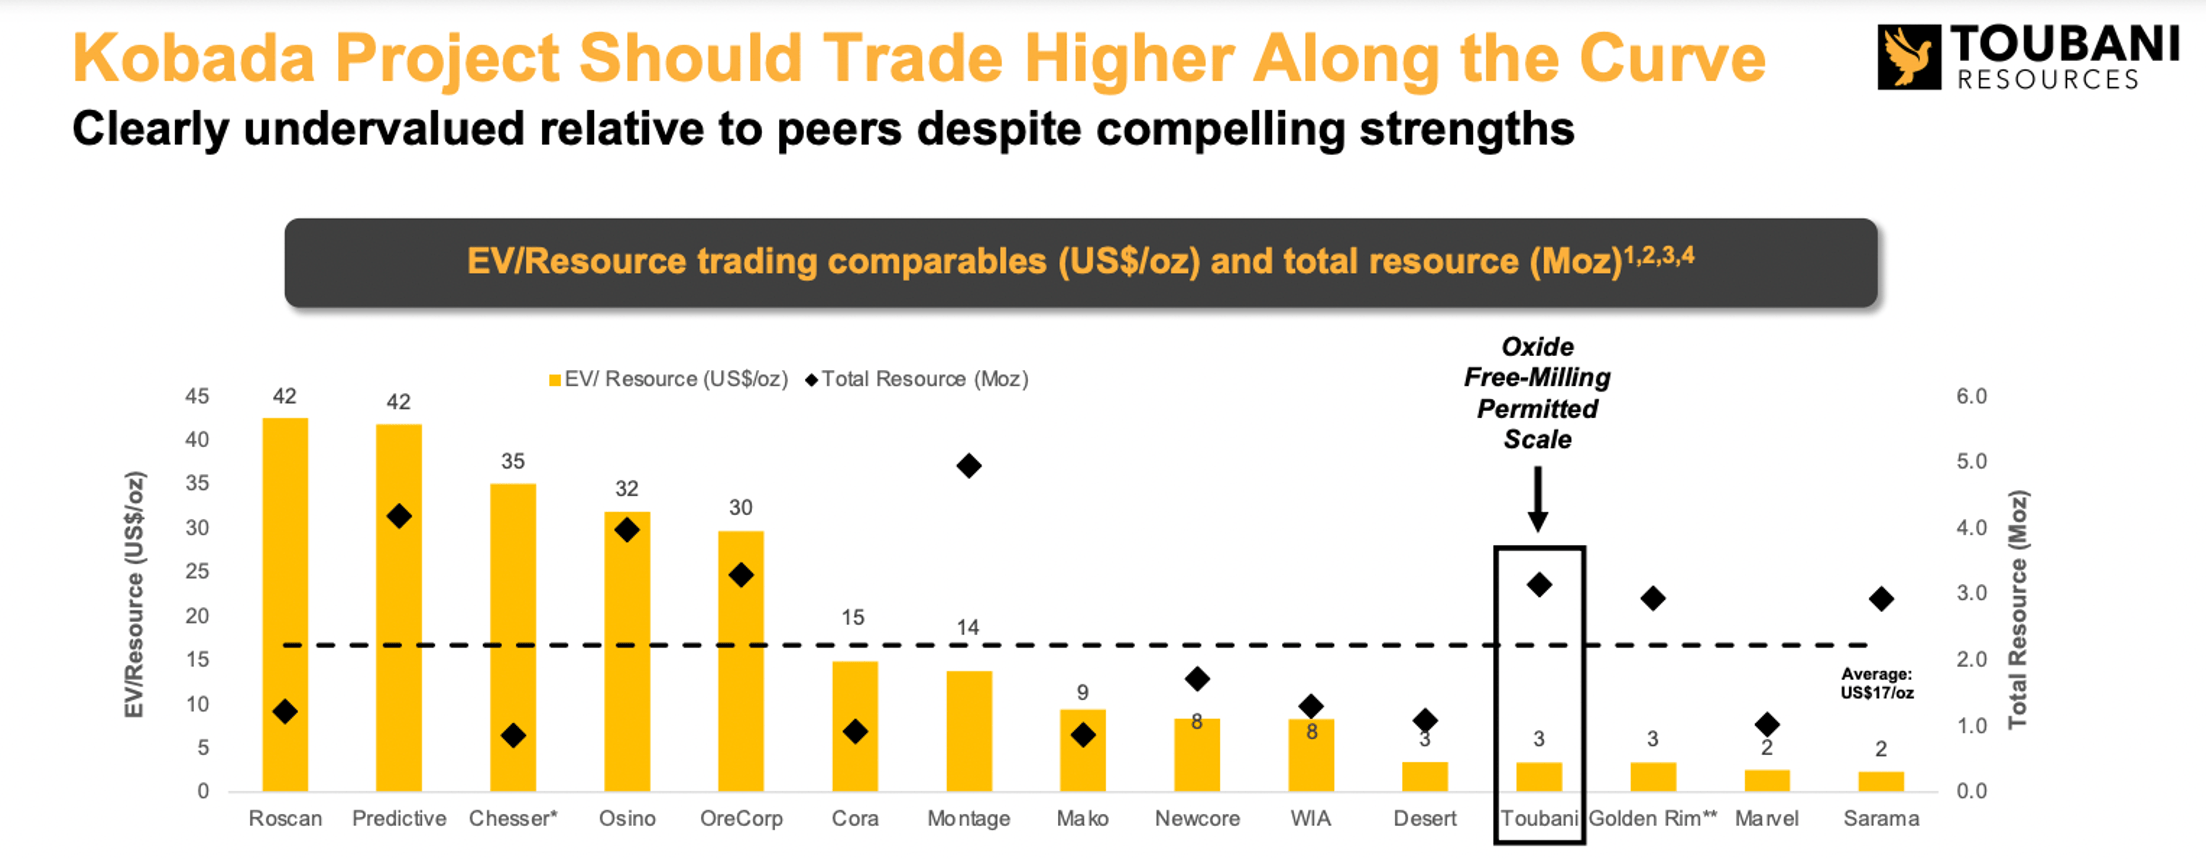
The Canadian explorer jumped ship to the ASX late November last year with the advanced 3.1Moz Kobada gold project in Mali.
This 4.5km-long resource ticks some important boxes; it is shallow, oxide dominant (softer ore), free-milling and potentially just one of multiple discoveries to be made at the project.
With ~$110m already spent on exploration and studies no significant resource drill-out programs are required ahead of a final investment decision, pencilled in for 1H 2025.
TRE is currently updating a 2021 feasibility study which outlined a +100,000oz per annum operation at US$972/oz AISC over the first 10 years, delivering a pre-tax NPV of $US506m and an IRR of 45%.
NPV and IRR are a measure of a project’s potential profitability; the higher they are above zero, the better.
The $15m capped stock is flat year-to-date, and reckons it is undervalued compared to its peers:
The Cuba-based gold-copper play is aiming to develop a pipeline of projects through its 49:51 mining joint venture with the Cuban Government’s mining company, GeoMinera SA.
The goal, initially, is to fund a copper porphyry hunt via its part-owned La Demajagua mine.
The La Demajagua open pit would produce 53,146tpa gold and 5905tpa silver and antimony concentrates for nine years, which is expected to be followed by underground operations.
An open pit Definitive Feasibility Study (DFS) is nearing completion which should allow construction to kick off Q4 2023.
AAU’s share of construction costs is expected to be ~$20m. Its share of LOM cash surplus will be $265m, it says.
WIA is getting thick and high grade extensional drill hits, just weeks after unveiling a monster 1.3Moz maiden resource for the Kokoseb gold deposit in Namibia.
The company is already working toward its next resource upgrade with new intercepts like 15m at 17.13g/t from 292m.
“Kokoseb, once again, is revealing its outstanding potential. Following the recent announcement of the initial mineral resource estimate of 1.3Moz at 1.0g/t Au, the latest RC drilling results have returned very high-grade, thick mineralised intercepts beneath the existing US$1,800/oz resource pit shells,” WIA exec Andrew Pardey says.
“Hole KRC086 confirms that high-grade mineralisation extends to almost 200m below the existing resource.
“It is also noteworthy in that it has an unconstrained intercept of 68m at 5.72g/t Au, which includes a series of 1m samples at over 10g/t Au, from which one is over 90g/t Au and two are in the order of 50g/t Au.
“Such a coherent zone of very high-grade mineralisation at depth opens a new and exciting chapter for the overall scale and grade potential of Kokoseb.”
The maiden resource was delivered just 11 months from the discovery drillhole, at a discovery cost of just US$2/oz.
WIA says this is one of the lowest resource discovery costs by industry standards.


Get the latest Stockhead news delivered free to your inbox.