


Twilio Inc. TWLO shares gapped down Thursday after EPS guidance came in below estimates. The company issued second-quarter adjusted EPS guidance of $(0.16) to $(0.13), versus the $(0.05) estimate.

Twilio Daily Chart Analysis
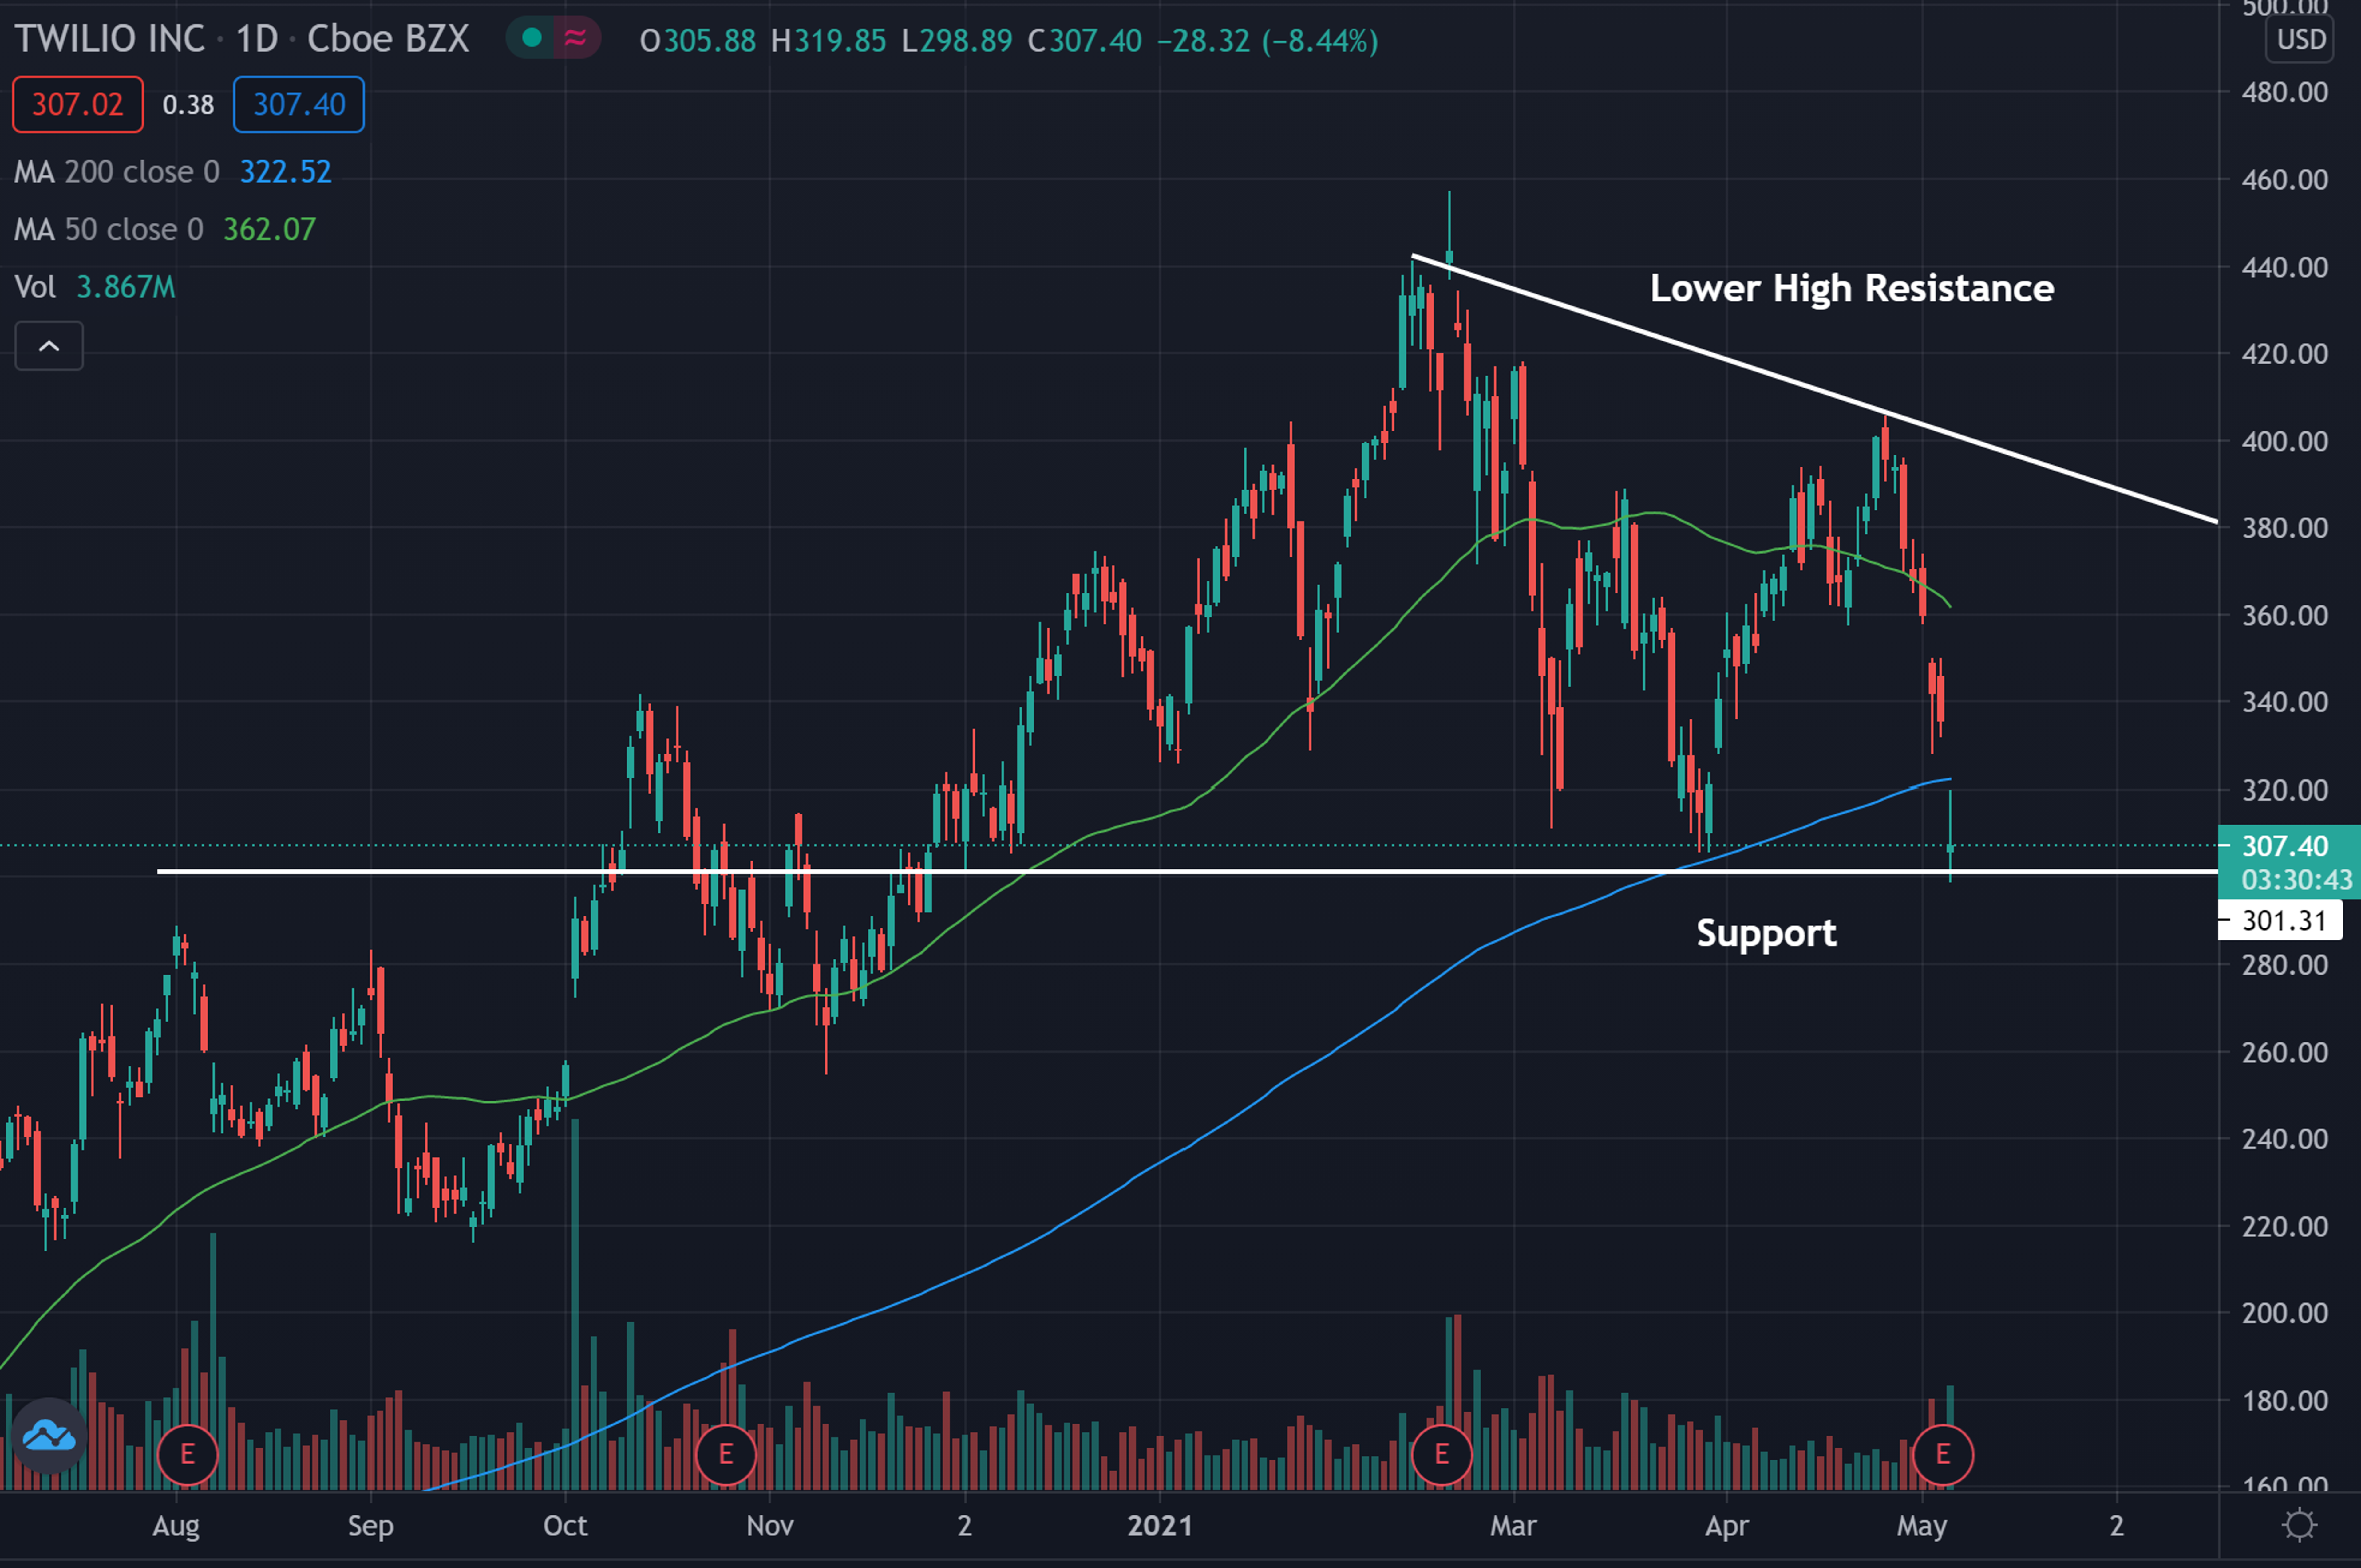
- Twilio looks to be trading within what technical traders may call a descending triangle pattern.
- The stock is trading below the 50-day moving average (green), and gapped below the 200-day moving average Thursday.
- The gap down below the 200-day moving average (blue) indicates that sentiment in the stock may be turning bearish.
Key Levels To Watch
- The stock looks to be trading in a descending triangle pattern and nearing an area that has held as support in the past. The descending triangle pattern is considered a bearish continuation pattern and a support break may bring a stronger push lower.
- The $300 level has previously held as support on the stock and may hold again in the future.
- The stock has been downtrending the past couple months by forming lower highs. This trendline has held as resistance previously and may again.
What’s Next?
Bullish technical traders would like to see the stock bounce near the $300 level and start heading up. Breaking the lower high trendline could signal the stock is changing trends.
Bearish technical traders would like to see the stock fail to hold the $300 level as support. Below this support, the stock could see a strong push downwards.
Twilio is a top 10 holding in the Ark Innovation ETF ARKK.
© 2024 Benzinga.com. Benzinga does not provide investment advice. All rights reserved.
Date | ticker | name | Actual EPS | EPS Surprise | Actual Rev | Rev Surprise |
|---|
Trade confidently with insights and alerts from analyst ratings, free reports and breaking news that affects the stocks you care about.

